


How is the NCAA Settlement Funded?
TLDR by Universities

A friend asked me last night who is paying the $2.8 Billion proposed settlement of the House v. NCAA antitrust lawsuits? The short answer is universities that play DI sports, but the longer answer is worth walking through. The basic settlement outline was agreed to last year, with the financing shared in the following manner:
Reports have the NCAA paying $1.1 billion of the $2.8 billion for past damages, with approximately $1.65 billion being paid by the Power Five and the remaining 27 Division I conferences paying $990 million.
That leads to another question, how does the NCAA get its money, and what does it do with it?
Sources of Revenue for the NCAA
The NCAA is a 501-c-3 non-profit corporation whose mission is to “Provide a world-class athletics and academic experience for student-athletes that fosters lifelong well-being.”
Hey, I am just the messenger here.
Most of the NCAA’s revenue comes from television and marketing fees for the NCAA Basketball Tournament ($950 Million of the $1.376 Billion) according to the consolidated financial statements for the academic year 2023-24, with ticket sales for all championships (not only Final Four, but think when your university ID will not get you in free to the second round field hockey NCAA game on campus and you must buy a ticket) and then investment gains. I am a little confused by the NCAA’s ‘investment’ line of $120 Million/year. It is listed as a revenue and that implies a flow of dollars. A $120 Million flow implies an endowment of ~ $2.5 Billion but the NCAA’s 990 form showed just $860 Million in assets. Even though shown in ‘revenue’ the words used are ‘investment gain’ but that seems like asset growth. I am unsure of exactly what investments represents for the NCAA, and it is shown as around 10% of annual revenues. Anyone know more?

Where Does the NCAA’s Money Go?
Most of the NCAA’s money flows out to universities via profit sharing from television and marketing ($948 Million in 2023-24) and the cost ($204 Million for DI) of running championships in 24 sports.

The DII ($60 Million) and DIII ($46 Million) figures shown are for the combined distribution from television and marketing plus the cost of running championships for these two divisions. Note that the revenues for championships in the first figure seem to combine DI-DIII, while the expenses have been provided in more granular format. The NCAA listed an expense of $2.7 Billion for the anti-trust settlement in their 2023-24 financial statements though the actual costs will be flowed over a decade and ‘clawed back’ from member universities via reduced revenue sharing.
Two points that I want to underline
There are numerous smaller expenditures of money that are nevertheless important, especially for players. For example, $26 Million annually in post eligibility medical insurance, and $89 Million in emergency funding for financial emergencies for players and their families.
The NCAA facilitates, runs and manages the NCAA Basketball tournament, and distributes profits from this to universities, in part based on performance in the tournament. How that money is shared by universities depends upon the rules of their conference. The NCAA has nothing to do with the College Football Playoff and the money therein. Those monies flow between conferences and television companies and Bowl games.
I still don’t understand how revenue sharing will work after the settlement is paid?
Let’s dig in for some detail can compare three conferences to get the lay of the land.
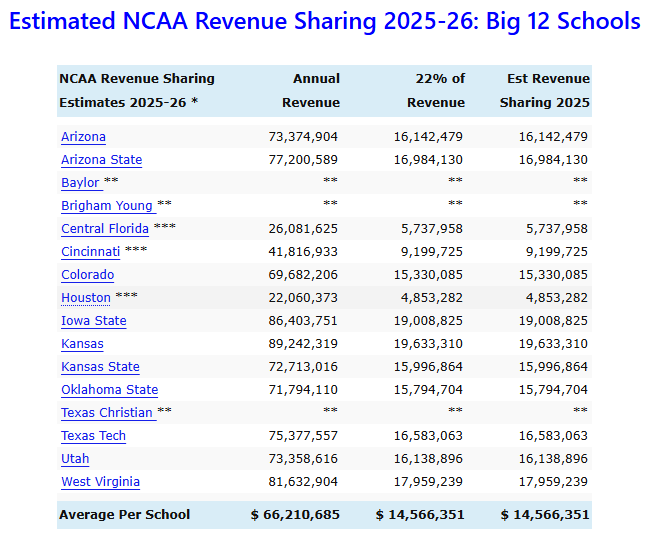
The Big 12 Conference projected 2025-26 revenue sharing for the public university members of their conference (Baylor, BYU, TCU are private and do not have to disclose) is below. Note that none of the conference members shown have bumped up against the $20.5 Million cap; they could all choose to spend $20.5 Million if they wished to do so. Note that the figures for Central Florida, Cincinnati, and Houston are based on their estimated revenue sharing prior to their joining the Big 12 conference. Their share will be much higher than shown, and that is of course, why they joined the Big 12 conference.
The figure below makes clear what I have said several times, that the big money is in football. Remember, this is the Big 12 conference only. Also note that the average per athlete assumes uniform payment, but that is not required. Universities must determine how they will pay players and presumably the stars will get much more, while others may get little or even none. That is to be determined. Note that revenue sharing does not include the cost of an athletic scholarship provided by the university (a cost to the university), nor does it cover third party NIL payments.

All conferences are not created equal, and the ACC is a more financially lucrative athletic conference than is the big 12. Same table, same source below for the projected ACC revenue sharing for 2025-26, with data for public universities only being shown.

Florida State and Louisville are capped at $20.5 Million, and UNC and Clemson are close. The laggards in the ACC publics would be the leaders in the big 12 publics, and both would be behind the SEC publics and the Big 10 publics.
This effect of the NCAA basketball tournament shares to conferences being linked with performance in same is clearly shown in the ACC table below. The average basketball payment per player is nearly a quarter of a million dollars if each player on a 12 man roster were paid the same. If you are a hoops fan, you will know that the past few years have been a story of the relative weakness of the ACC in men’s basketball, and that will be shown in the future since shares are calculated using a rolling 6 year average performance in the NCAA basketball tournament. Since 2015, Duke (2015), UNC (2017) and Virginia (2019) have won a national title in basketball, and both Duke and UNC have been to two other final fours. Miami and Syracuse have also appeared in the final four since 2015.

And just to show the math about football leading the way in terms of money, here is the SEC’s projected revenue for 2025-26; the only public university not immediately against the cap is Mississippi State, and they are close ($19.3 Million). Vanderbilt is the only private university in the SEC.

Policy questions for universities
How will the amount paid to players within football and men’s basketball be determined? As a former lineman, I would like to put in a pitch for the blindside tackle.
Will some sort of indirect cost recovery, or cost sharing be charged to players? I think it is allowable given that universities determine how players are paid their revenue share. Is that an individual university decision? A shared decision with the conference? If a professor gets a research grant, there is indirect cost recovery that pays for infrastructure and all of these universities have huge infrastructure costs.
The fact that this settlement is not afoul of Title 9 must be related to the market determination of TV rights? Because women’s sports are not excluded, but the amount they receive is based on revenue.
How many sports will universities field teams in? The SEC tends to play fewer and focus. Duke and UNC play many and seek to compete in the Capital One cup.
How are universities going to pay for their share of the settlement costs? Recall the responsibility to meet the costs of the settlement are split as shown below. However, I have in mind cash flows. I think a universities share is to be paid over a decade via reduced flows from the NCAA….but if so I am unclear how the NCAA will flow that much cash at once given that the NCAA does not have anything like that in assets (2023 form 990 shows $860 Million). This part is still somewhat unclear to me. To say that it is a bad time to have to flow cash for a university is an understatement.
Reports have the NCAA paying $1.1 billion of the $2.8 billion for past damages, with approximately $1.65 billion being paid by the Power Five and the remaining 27 Division I conferences paying $990 million.
The settlement clearly made sense for the SEC and Big 10 given the estimated potential cost of a lost lawsuit being at least double the $2.8 Billion and the fact that their TV contracts are so much larger than the other 3 power 5 conferences.
SCHOOL PAYOUTS
Twelve of the 14 Big Ten schools each received about $60.5 million from the conference, with 2014 additions Maryland and Rutgers getting about $58.8 million apiece.
The SEC distributed $51 million to each school. Each ACC school received between $43.3 million and $46.9 million; Notre Dame, an independent in football, received $22.1 million.
Big 12 schools received distributions ranging from $43.8 million to $48.2 million. The Pac-12 distributed about $33.6 million to each of its members, down from $36 million the previous year.
So yes, Rutgers got more in television royalties from a football rights contract than did Alabama and Georgia showing why the potential movement of schools between conferences is such a big deal financially.
The bottom line for football and men’s basketball players beginning in the fall of 2025 is that they will:
In aggregate receive 6 figure payments from university revenue sharing.
receive an athletic scholarship and other resources.
benefit from the NIL collective set up as a third party.
As a policy analyst, this all seems just based on the market flows generated by the players. As a faculty member who has had a long career in shared governance at one university, and who looks with trepidation at the next months and years in higher education, I am not sure what to think.